Ubuntu に Gnuplot をインストールして、X11 ウィンドウに描画しようとしたらうまくいかずに少しはまったのでブログに残しておきます。
環境
- Ubuntu 14.04 (Trusty Tahr) Server
まず gnuplot パッケージのみインストールします。
$ sudo apt-get install gnuplot
gnuplot を実行すると以下のように最後に Terminal type set to 'unknown' と表示されました。
$ gnuplot

    G N U P L O T
    Version 4.6 patchlevel 4    last modified 2013-10-02
    Build System: Linux x86_64

    Copyright (C) 1986-1993, 1998, 2004, 2007-2013
    Thomas Williams, Colin Kelley and many others

    gnuplot home:     http://www.gnuplot.info
    faq, bugs, etc:   type "help FAQ"
    immediate help:   type "help"  (plot window: hit 'h')

Terminal type set to 'unknown'
gnuplot>
terminal を x11 に変更しようとしても以下のようにエラーになります。
gnuplot> set terminal x11
Terminal type set to 'unknown'
                      ^
         unknown or ambiguous terminal type; type just 'set terminal' for a list
この状態でグラフを描画してもなにも表示されません。
gnuplot> plot sin(x)
- X11 ウィンドウに描画されたグラフが表示されて欲しいのですが、なにも表示されません。
ぐぐってみると、Ubuntu の場合は gnuplot-x11 が必要なのでこれもインストールします。
$ sudo apt-get install gnuplot-x11
gnuplot を実行すると Terminal type set to 'unknown' となっていた箇所が Terminal type set to 'wxt' と表示されました。
$ gnuplot

    G N U P L O T
    Version 4.6 patchlevel 4    last modified 2013-10-02
    Build System: Linux x86_64

    Copyright (C) 1986-1993, 1998, 2004, 2007-2013
    Thomas Williams, Colin Kelley and many others

    gnuplot home:     http://www.gnuplot.info
    faq, bugs, etc:   type "help FAQ"
    immediate help:   type "help"  (plot window: hit 'h')

Terminal type set to 'wxt'
gnuplot>
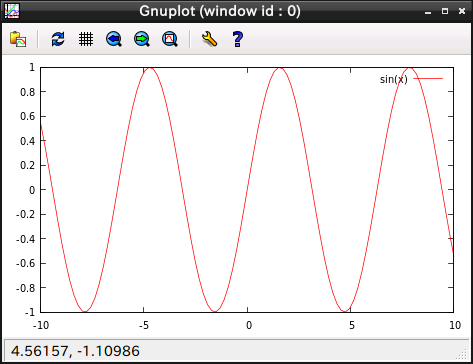
無事、X11 ウィンドウに描画されました。
gnuplot> plot sin(x)
0 件のコメント:
コメントを投稿